


ASSIGNMENT 3
MAKING DATA REAL:
SOCIAL CONNECTEDNESS IN NEW ZEALAND ADOLESCENTS.
Designed by : Joshua Taulapapa, jtau511 – Emma Tiplady, etip108 – Roy Tam, ctam883 – Anna Chen, zche448
PROBLEM
Social connectedness is an indispensable part of happiness. According to the Ministry of Social Development (2005), people are defined by their social roles, whether as partners, parents, children, friends, caregivers, teammates, employees or employers, or a variety of other roles. Interpersonal relationships give people support, happiness, satisfaction, and belonging, and play a role in society. They also mean that people have an appropriate support network and they can seek help during difficult times.
We will be focusing on adolescents, between the ages of 17-22 years of age. We have chosen this demographic of people because we as a group fit into this age demographic, and can not only focus a lens on social connectedness issues, but live through them also.
The problem is caused by social media and how people nowadays tend to abuse the way we use it. It’s easy to fake being “connected” just by following or liking someone’s posts, but that doesn’t mean that you’ve spoken or truly interacted properly. Social media is creating a sense of false reality when it comes to the relationships, and that is the type of data we will be looking at. Finding out how people are using their social media is crucial for us to begin looking for solutions in increasing genuine social connections.
We will be visualising the different types of social media that are being used in our age demographic as of today. This data will be able to show the different percentages of which social media are the most popular, and then we will be analysing the data further to see what this tells us about the people within our age demographic and there social media usage (according to which is their most loved kind, and thus showing what part of social connectedness is meaning the most to them).

DISCOVER


DEFINE
Among all the people that took our survey, 85% of them use social media. Facebook and Instagram have the same percentage of users, but the purpose of using both social media is different. More people use Instagram as social use than Facebook. More people use Facebook as communication than Instagram. According to the result of the survey, Facebook is a more popular application for communication purposes than Instagram. Messenger is a communication app that was developed by the Facebook team as a derivative product for Facebook users to communicate more effectively. Almost 90% of people use Messenger for communication purposes. We could assume that almost every person who uses Facebook uses Messenger.
DEVELOP
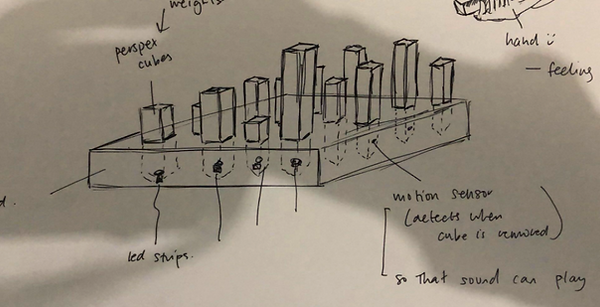
This is the initial design idea sketch. We will be using the data that was collected from the survey to present how many people use social media for whatever reason.
PROTOTYPE


DELIVER


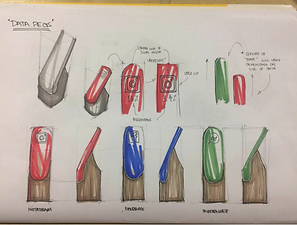
VISUAL PROTOTYPE


MEASUREMENTS


THE MEASUREMENTS OF THE DATAPEG CHANGES BASED ON THE PERCENTAGE OF DATA
SPECIFICATION DETAILS
